What a scatterplot can show
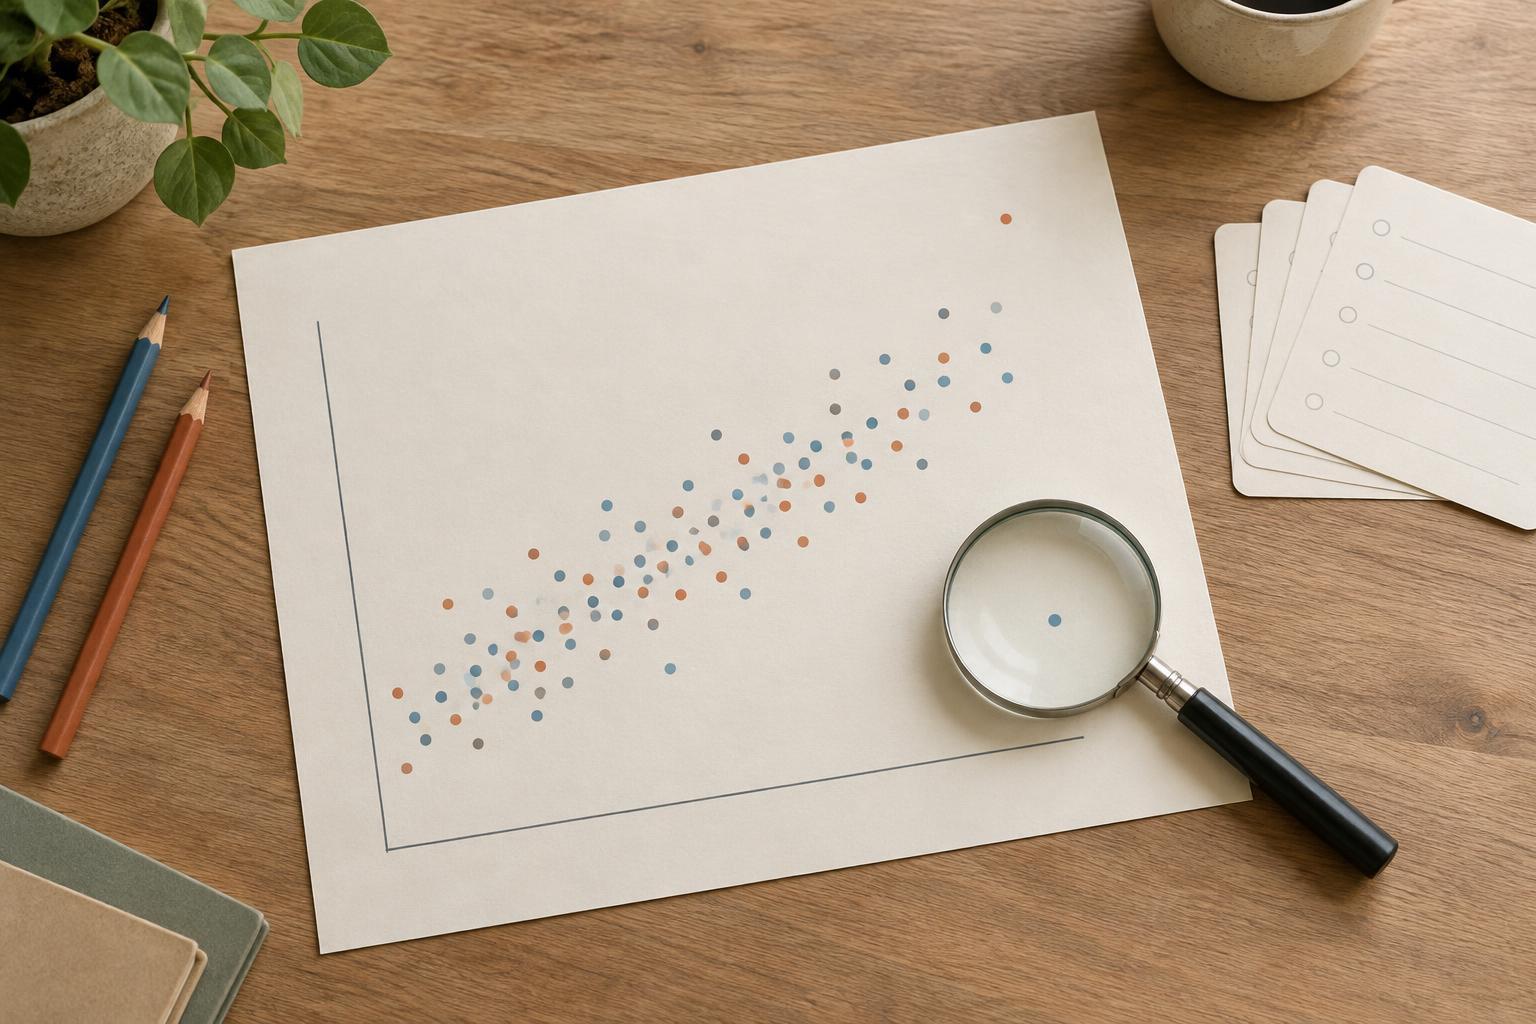
A scatterplot places one observation at each pair of values on two numerical axes. In consumer research, a dot might represent one survey respondent, with satisfaction on the horizontal axis and reported monthly spending on the vertical axis. The chart lets you see whether higher values on one measure tend to appear alongside higher or lower values on the other. It can also reveal clusters, unusual observations and ranges where a relationship seems stronger or weaker.
Before making the chart, define what each dot represents. A plot of individual customers answers a different question from a plot in which each dot represents a store or an audience segment. Label both axes with the measure and its unit, and make clear whether a value comes from a direct question, a calculated score or an estimate. These choices help readers understand the pattern before they try to interpret it.
Choose variables that support a useful question
Start with a question rather than a pair of available columns. For example: Do respondents who rate the purchase experience more highly also report greater intent to return? That question suggests two measures to plot and a reason to examine their relationship. Check that both measures refer to a comparable period and that higher numbers mean what readers are likely to assume they mean.
Inspect the underlying data as well. Missing answers, duplicate records and inconsistent units can change the appearance of a chart. If satisfaction is measured on a short rating scale, many dots may overlap at the same positions; smaller marks or slight visual separation can make the concentration easier to see. If spending has a few very large values, examine those records before changing the axis or excluding them. An unusual point may be a valid customer, a data-entry error or a sign that the group needs a closer look.
Read the pattern, not just the direction
A relationship is more than an upward or downward tilt. Look at how tightly points gather, whether the pattern curves, and whether the spread changes across the chart. A loose cloud may offer little basis for predicting an individual customer’s value, even if its overall direction is visible. A cluster of similar dots may reflect a distinct type of respondent rather than one pattern shared by everyone.
Where useful, distinguish groups with color or separate panels, such as first-time and returning customers. A pattern visible in the combined data may weaken or change when groups are viewed separately. Keep the grouping simple enough to read, and avoid using color as the only way to identify a group. A trend line can help summarize a pattern, but it should not hide the points or imply more precision than the data warrants. Show the observations and explain what the line summarizes.
Why the chart cannot establish cause
Suppose satisfaction and spending rise together. The chart does not show that improving satisfaction will increase spending. Customers who spend more might receive more attention and therefore report greater satisfaction. A third factor, such as how often someone shops, might influence both measures. Survey answers collected at one point in time may not even establish which came first.
Use language that matches the evidence: “Higher satisfaction scores were associated with higher reported spending in this sample” describes the plot. “Satisfaction drove spending” makes a causal claim the plot cannot support. Also note the scope of the data. If respondents were recruited from a particular customer list, the chart describes those respondents; it does not automatically represent every potential customer. A scatterplot is a prompt for better questions, not a shortcut to a causal conclusion.
Turn the finding into a responsible next step
A useful chart ends with a decision about what to examine next. If the relationship differs between new and returning customers, review whether the groups answered the questions in the same way. If a few observations create most of the apparent trend, inspect them and show how the chart looks with and without them, explaining why each view matters. If the pattern holds across relevant groups, consider follow-up interviews to understand customers’ experiences in their own words.
When sharing the chart, include the question it addresses, what each dot represents, the measures used and any important limits of the sample. Describe the visible pattern separately from possible explanations. This gives a team something practical to discuss—such as which customer experience to investigate—without treating an exploratory picture as proof of what will happen if a business changes course.