Start with the claim the visual appears to make
Before checking colors or fonts, ask what a reader is likely to conclude from the visual at a glance. Write that takeaway in one sentence, then compare it with the underlying data. If the chart seems to say that one audience prefers a product, but the survey only measured awareness, the problem is not cosmetic. The visual or its accompanying text needs to change.
Check that the title describes the measure rather than announcing a stronger conclusion. “Share of respondents who recognized each brand” is more precise than “Most popular brands” when recognition was the question asked. Read the survey wording, response options and any filters alongside the chart. A small difference in wording, such as “would consider” versus “has purchased,” can change what the results mean.
Trace every number back to its base
Confirm that plotted values match the approved data table, including any rounding. Check whether a percentage uses all respondents, only people who answered a question, or a filtered group such as recent buyers. State the base near the chart when it is needed to understand the result. If groups have different bases, make that visible rather than leaving readers to assume they are equal.
Check how missing answers, “don’t know” responses and multiple-selection questions were handled. Percentages from a question that allows several answers need not add to 100%; a note should explain why. For interview-based visuals, avoid presenting counts of comments as though they estimate how common a view is in a wider population. An interview theme can be valuable without being a population percentage.
If the data was weighted, aggregated or transformed, ensure the display reflects that decision and that a brief explanation is available. Recalculate derived figures such as percentage-point differences rather than copying them from an earlier draft. A final data check is especially useful after changing filters, categories or chart order.
Test the chart’s comparisons and scales
Choose a form that fits the question. Bars make category comparisons easier to inspect; lines are generally more suitable for ordered time points. Avoid connecting categories with a line if the connection implies a continuous path that does not exist. If the main message depends on a small gap, show the actual values so readers can judge its size.
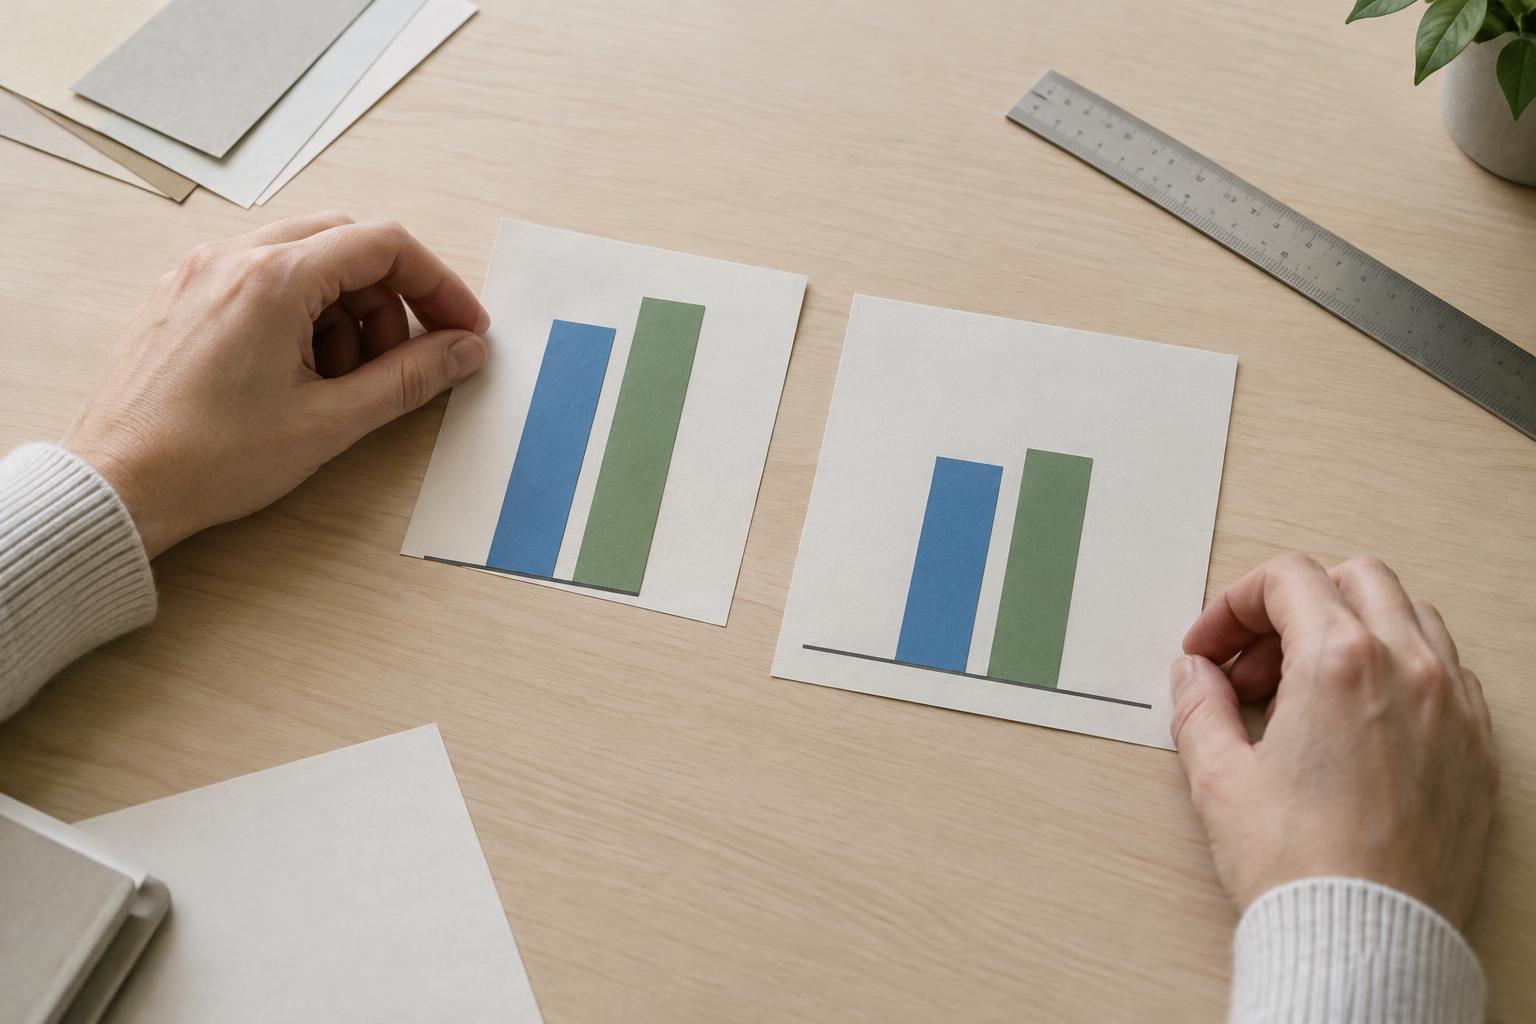
Inspect the axis limits, intervals and units. Bars usually need a zero baseline because their lengths encode magnitude. A narrower vertical range can help reveal changes in a line chart, but the range should be clear and should not make a modest movement look dramatic. Use consistent scales for panels intended to be compared directly. Check that sorting, omitted categories and changes to time intervals do not quietly alter the story.
Look carefully at comparisons between groups. A difference in percentages is not the same as a difference in percentage points: a move from 20% to 25% is five percentage points. If group definitions overlap, say so. If a segment is small, avoid a confident headline based solely on its apparent ranking.
Make limitations visible without burying the chart
A chart should carry enough context to stand on its own when copied into a slide or shared separately. Identify what was measured, whom the figures describe, the relevant period if one applies, and the unit used. Define abbreviations and category labels that an unfamiliar reader might not recognize. Notes should answer likely questions, not serve as a place to hide qualifications that would change the headline.
Consider whether the display needs to show uncertainty or a caution about interpretation. Small differences may not support a meaningful distinction, particularly when estimates come from a sample. The appropriate explanation depends on how the research was designed; do not add an error bar or a claim of statistical significance unless it is justified by the method used. Where a chart is descriptive rather than representative, say what it describes.
Do a final reader and accessibility pass
Review the visual at the size and in the setting where it will appear. Can readers distinguish categories without relying only on color? Are text, symbols and lines legible? Direct labels may be easier to follow than a distant legend, especially in a chart with several series. Provide a concise text description that communicates the main pattern and important qualifications for people who cannot use the image.
Finally, ask someone who did not build the chart to describe its takeaway and point to the evidence for it. If their reading differs from the intended message, revise the visual before publication. The goal of this checklist is not to make every chart elaborate. It is to make the path from evidence to interpretation visible enough that readers can understand both the finding and its limits.