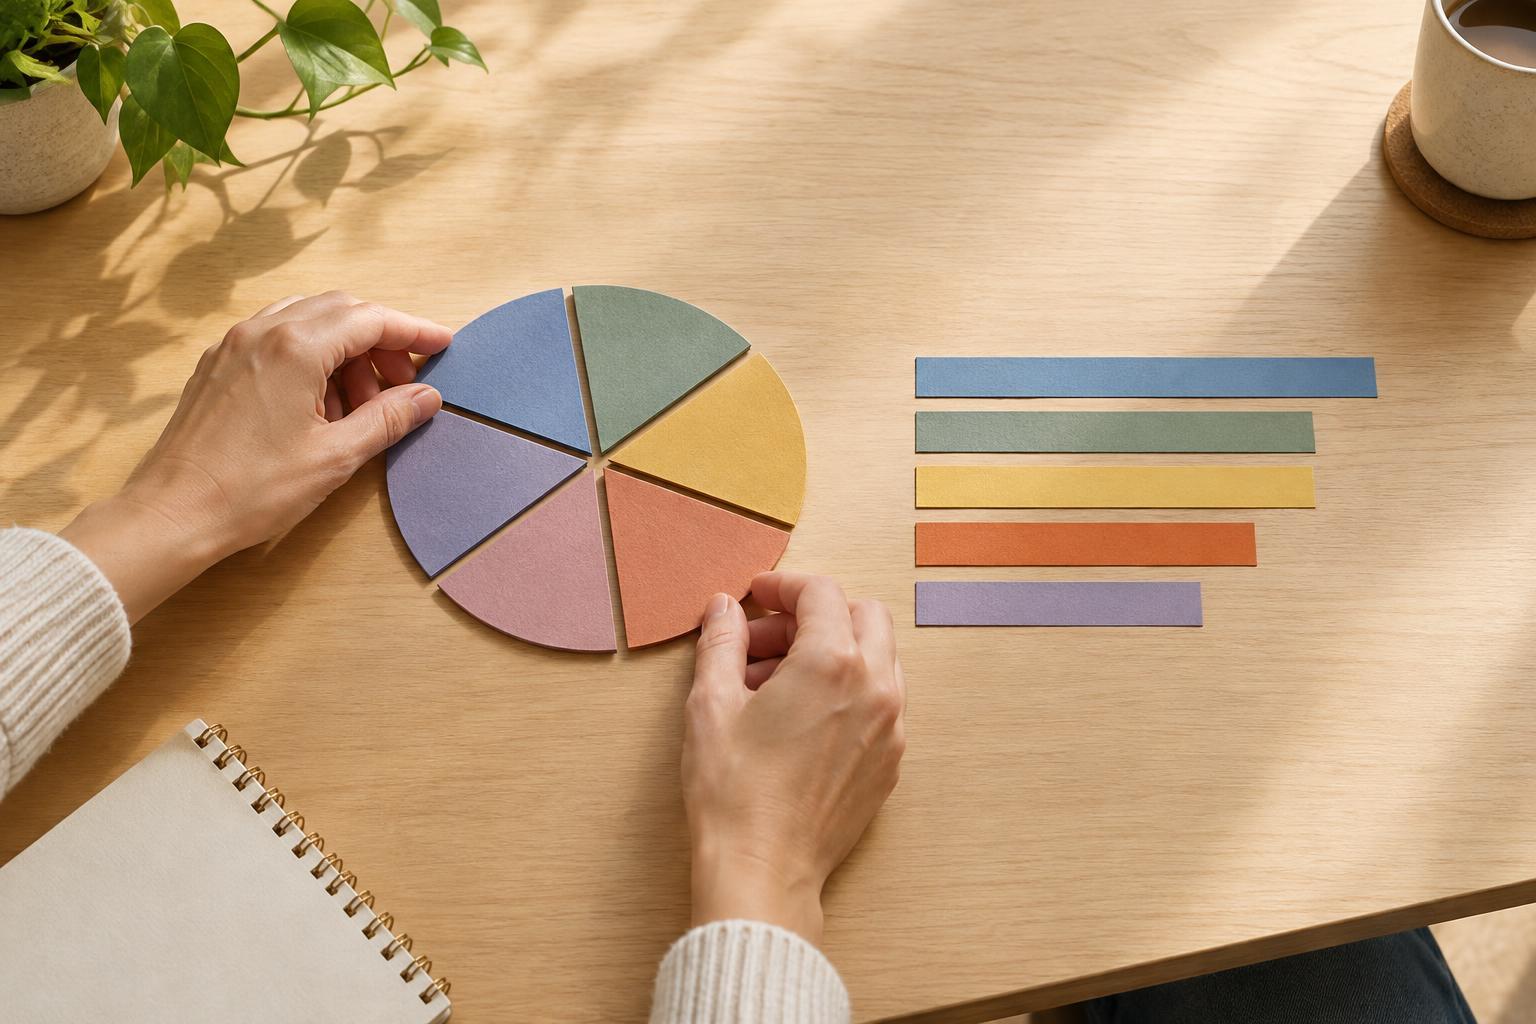
A pie chart answers one question well
A pie chart shows parts of a whole. If survey respondents choose one preferred shopping channel from a set of mutually exclusive options, the slices can convey the broad distribution at a glance. A dominant category may stand out, and a small category may look small without much effort from the reader.
The difficulty begins when the point of the chart is not the overall pattern but a close comparison. Suppose two options account for 28% and 26% of responses. Their slices will look much alike, even though a researcher may want readers to notice which is higher. The chart asks the eye to judge the difference between two angles or areas. That is harder than comparing two marks that start from the same baseline. A pie chart can therefore be accurate while still making the intended finding difficult to see.
Why similar slices are difficult to judge
In a bar chart, nearby values can be compared by looking at where the bars end. In a pie chart, each slice starts at a different angle and has a different position around the circle. Readers often have to move their attention between slices, remember one shape, and then estimate whether the next is larger. Color can help them locate categories, but it cannot make a narrow difference in size obvious.
Other design choices can add friction. A chart with many slices leaves less room for each category and its label. A legend forces readers to match colors to names, sometimes repeatedly. Three-dimensional effects or separated slices may draw attention, but they can also distort the visual impression of size. Direct percentage labels remove some guesswork; if readers must rely on the labels to make every important comparison, however, the pie itself is doing little of the work.
Start with the decision the chart should support
Before choosing a chart, write down the question a reader needs to answer. “How is the total divided?” points toward a part-to-whole display. “Which of these options is slightly more common?” calls for a display that supports precise comparison. In consumer research, that distinction matters: a chart meant to guide priorities should not hide a close ordering behind an attractive shape.
Check the data as well as the message. A conventional pie chart assumes categories are parts of the same whole and do not overlap. If survey participants could select several answers, their percentages may add to more than 100%. Turning those responses into pie slices would suggest a division of the total that does not exist. A bar chart can show each option’s share of respondents without implying that choosing one ruled out the others.
Choose a clearer alternative for close values
For a single set of categories, a sorted horizontal bar chart is often a practical replacement. It gives every value the same baseline, makes longer category names easier to read, and puts close results next to each other. Add value labels when the exact percentages matter. Keep the scale consistent and avoid truncating a bar chart’s numeric axis in a way that exaggerates a small gap.
A dot plot is another compact option when the focus is on comparing values rather than showing how a total is divided. For two groups, aligned bars or dots can reveal differences across categories more readily than a pair of pies. A 100% stacked bar can show the composition of each group, but its middle segments do not share a baseline, so it may still be a poor choice when those segments are the main comparison.
Make the size of the difference clear
A clearer chart does not make a small difference more meaningful. If two survey options are close, describe the gap plainly rather than calling one a decisive winner. Consider whether the sample, question wording, rounding, or way respondents were recruited limits what the comparison can support. The chart should help readers see the result; the accompanying text should help them interpret it with appropriate care.
Pie charts still have a place when there are few categories, the parts form a genuine whole, and the message is about the broad composition rather than a narrow ranking. When the takeaway depends on telling nearly equal values apart, choose a shared baseline and clear labels instead. Match the display to the question, and readers can spend less effort decoding the graphic and more effort considering what the findings mean.