Why a percentage needs a denominator
A percentage describes a share of something. In a survey chart, readers need to know what that “something” is: all survey respondents, people who answered a particular question, or a smaller group selected by an earlier answer. A label such as “60% prefer option A” leaves that distinction open. “60% of respondents who answered this question (n=100)” gives readers a firmer basis for interpreting the result.
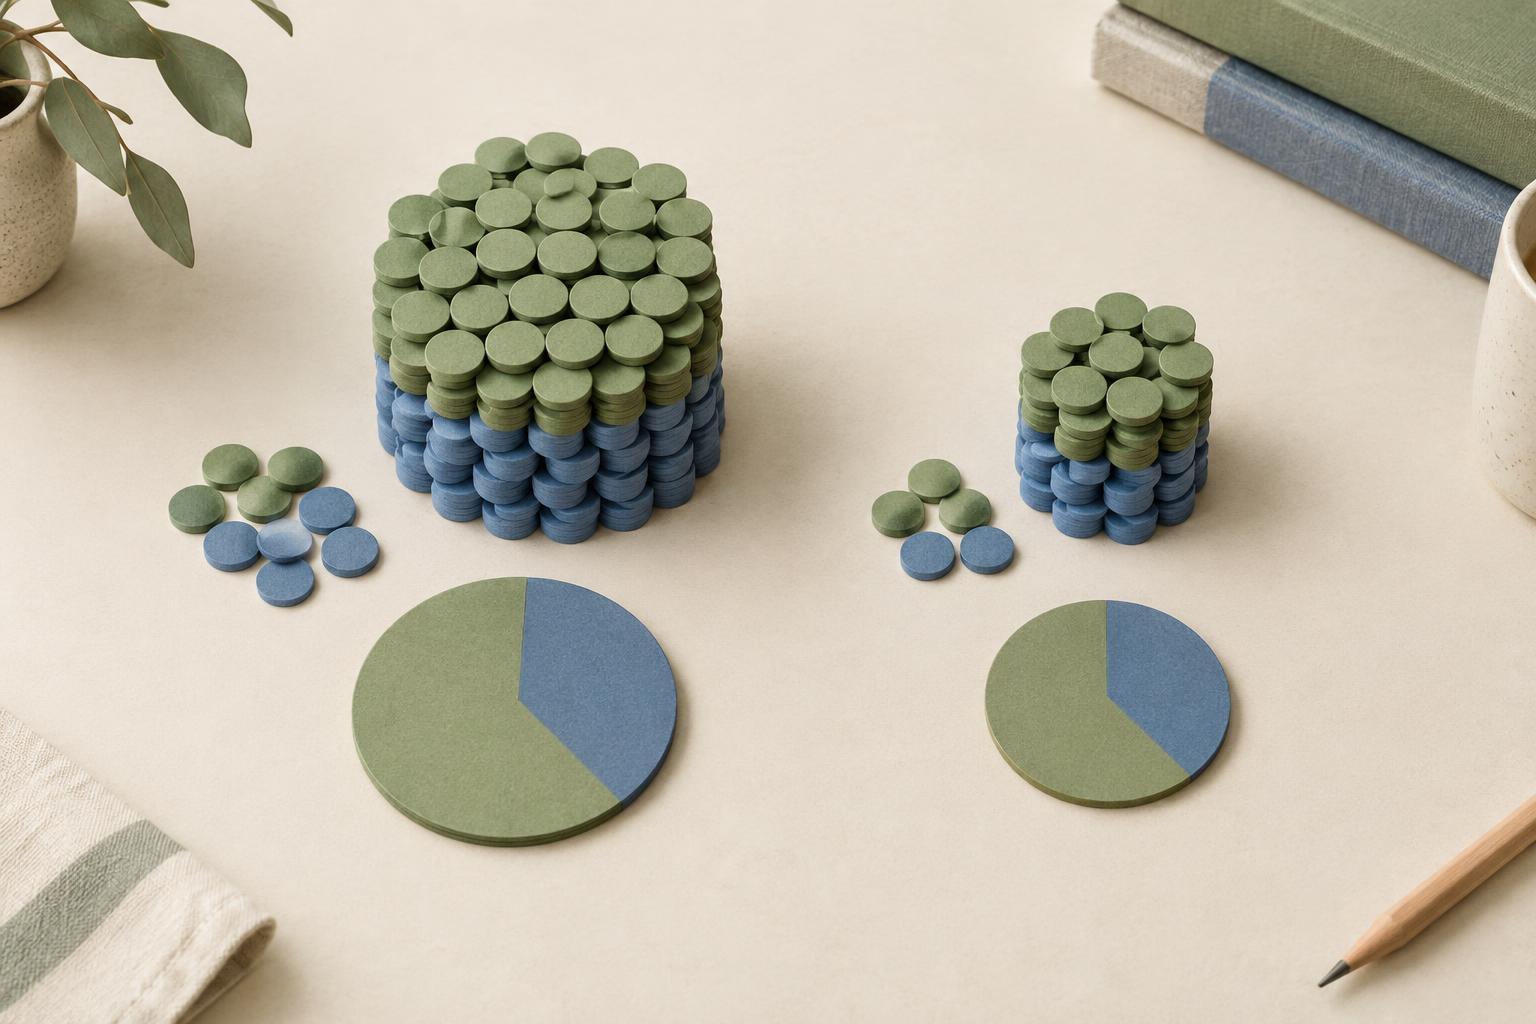
Sample size also changes how a finding feels in practice. Sixty out of 100 respondents and 12 out of 20 respondents both equal 60%, but the second result rests on fewer answers. Showing the number does not, by itself, establish how representative either group is. It does help prevent a small group’s result from looking as substantial as a larger group’s simply because both are displayed as percentages.
Use the number of people who could answer each question
The total number of survey participants is not always the right number to put beside a result. Some people skip questions, stop early or are directed past questions that do not apply to them. If 200 people begin a survey but only 173 answer a question about delivery preferences, use 173 as the base for that question’s percentages. Calling it “n=200” would make the chart appear to include answers that were never given.
Define the base in ordinary language wherever it might be unclear. “Base: respondents who purchased in the past month (n=84)” tells readers more than “n=84” alone. For a filtered question, the base should reflect the people eligible to see and answer it, while the displayed response percentages should reflect the answer records used in the calculation. If eligible people skipped the question, note that distinction rather than treating eligibility and completed answers as interchangeable.
Multiple-selection questions need particular care. When people can select more than one answer, each percentage may represent the share of respondents who selected that option. The bars can therefore add up to more than 100%. A short note—“Respondents could choose more than one; base: 173 who answered”—usually does more work than trying to explain the chart through its title alone.
Put the base where the reader will look
For a chart with one shared base, place the sample size in the subtitle or a note immediately below the chart: “Base: all respondents who answered (n=173).” If bases differ across bars, put each number close to its bar or category label. A distant footnote is easy to miss when a chart is copied into a slide or read out of context.
When comparing groups, label the base for each group rather than reporting only the combined sample. A chart comparing first-time and repeat customers might show “First-time customers (n=48)” and “Repeat customers (n=125)” in the legend or beside the group labels. This makes uneven group sizes visible before readers compare their percentages. Keep the notation consistent throughout a report: choose a style for “n,” explain what it counts, and use that style across figures.
Exact counts can sometimes be clearer than percentages, especially for small groups. Instead of giving “67%” without context, write “8 of 12 respondents.” You can include both if comparison across groups matters, but avoid adding so many labels that the chart becomes difficult to scan. A concise chart should answer two questions quickly: what share gave this answer, and how many people does that share represent?
Make comparisons without overstating them
A visible sample size is a prompt to interpret differences carefully, not a built-in test of whether those differences are meaningful. If one subgroup has 15 respondents and another has 150, a small gap between their percentages is a weak basis for a confident claim. Use wording such as “In this survey, the smaller group was more likely to select this option” rather than presenting the gap as a settled fact about the wider audience.
Small bases also make precise-looking labels less helpful. For a group of 12, a single answer changes the percentage noticeably. Showing a whole-number percentage alongside “n=12,” or using a count, keeps the display honest without burying readers in decimal places. If a subgroup is so small that displaying its result could risk identifying individuals, combine categories where appropriate or leave that breakdown out.
Check what the displayed number actually means
Before publishing a chart, trace one bar back to the underlying answers. Confirm which respondents were included, how missing answers were handled, and whether the percentage uses people or responses as its denominator. Then check that the title, labels and base note describe that same calculation. This simple review can catch a common mistake: placing the survey’s overall sample size beside a result calculated from a filtered subset.
Weighted results require another distinction. If responses were weighted, say that the percentages are weighted and identify whether the displayed n is the unweighted number of respondents. The number of people who answered is still useful context, but it is not the same thing as a weighted total. If a report uses other measures of sample precision, label those separately rather than making an ordinary respondent count stand in for them.
The goal is not to cover every chart with technical notes. It is to give readers enough context to understand a percentage before drawing a conclusion from it. A clear base label, placed close to the finding and matched to the calculation, makes survey visuals more useful for decisions.